



Science helps us understand the world through observation, testing, measurement, and evidence. To make scientific information easier to organize, students and professionals often rely on structured tools. One useful tool is a science table, which presents information in an organized format and helps readers compare facts, observations, measurements, and results. Whether you are studying biology, chemistry, physics, or environmental science, a well-designed science table can make complicated information easier to understand.
A clear table can turn large amounts of information into a simple visual structure. Instead of reading several paragraphs to compare results, students can quickly examine rows and columns. This approach also supports accurate recording during experiments. In classrooms, laboratories, research projects, and science reports, the right science table can improve organization and reduce confusion.
What Is a Science Table?
A science table is an organized arrangement of scientific information using rows and columns. It may contain measurements, observations, classifications, experimental results, formulas, properties, or comparisons. The exact design depends on the purpose of the scientific activity.
For example, a student conducting an experiment may use a table to record temperature changes over time. A biology student may use one to compare characteristics of different organisms. Similarly, a chemistry learner can organize elements according to properties such as atomic number, symbol, and atomic mass.
The main purpose of a science table is to make information easier to record, compare, analyze, and communicate.
Why Is a Science Table Important?
Scientific work depends heavily on accurate information. When observations remain scattered across notebooks or separate pages, finding patterns becomes difficult. A science table provides a consistent structure that keeps related information together.
Tables are especially useful when an investigation produces many measurements. Students can record each observation in a specific column and place every test or sample in a separate row. This organization makes later calculations and comparisons much easier.
A science table also improves communication. When teachers, classmates, or researchers review scientific results, they can understand the information quickly without searching through lengthy explanations.
Common Types of Science Tables
Different scientific tasks require different table formats. There is no single design that works for every situation.
Observation Tables
An observation table records what a student or researcher notices during an experiment. It may include changes in color, texture, temperature, movement, smell, or other measurable characteristics.
For example, a plant growth experiment could record the height of a plant every two days. The table would provide a simple record of how growth changed throughout the investigation.
Data Tables
A data table focuses on numerical measurements. It may contain values such as mass, volume, distance, time, pressure, or temperature.
A well-organized science table should include clear headings and appropriate measurement units. This helps readers understand exactly what each number represents.
Comparison Tables
Comparison tables place different scientific objects or concepts side by side. Students can compare animals, chemical substances, planets, materials, or physical processes.
For example, a comparison table about planets might include their size, distance from the Sun, number of moons, and orbital period. This format allows important differences to become immediately visible.
Classification Tables
Classification tables group scientific items according to shared characteristics. Biology students often use this approach when studying organisms.
A classification-based science table might organize organisms according to kingdom, class, habitat, diet, or other characteristics.
Experimental Results Tables
Laboratory experiments often produce several sets of results. An experimental results table allows researchers to record the independent variable, dependent variable, repeated trials, and final observations.
This format can help identify unusual results and compare different trials more effectively.
How to Create an Effective Science Table
Creating a useful science table does not require complicated software. The most important factor is clarity.
Start With a Clear Purpose
First, decide what information the table needs to communicate. A table designed for recording experiment results will look different from one designed to compare scientific concepts.
Understanding the purpose prevents unnecessary information from making the table difficult to read.
Use Descriptive Headings
Every column should have a clear heading. Readers should understand the information without needing additional explanations.
For numerical data, include the measurement unit when appropriate. For example, write “Temperature (°C)” rather than simply “Temperature.”
Keep Information Consistent
Use the same format throughout the table. If measurements use centimeters in one row, avoid switching to meters without explanation.
Consistency makes a science table easier to analyze and reduces the possibility of interpretation errors.
Record Data Carefully
Scientific observations should be recorded accurately. Avoid changing measurements simply because they appear unusual. Unexpected results can provide important information and may lead to further investigation.
A carefully maintained science table preserves the original evidence collected during an experiment.
Science Tables in Biology
Biology involves the study of living organisms, cells, ecosystems, genetics, and many other subjects. Because biology often requires comparisons, tables can be particularly helpful.
Students might create a table comparing plant and animal cells. Columns could include the cell wall, nucleus, chloroplasts, vacuole, and cell membrane. Another table might compare mammals, birds, reptiles, amphibians, and fish.
A science table can also help biology students organize experimental observations. For example, they may record how different environmental conditions affect plant growth.
Science Tables in Chemistry
Chemistry depends heavily on organized information. Students regularly work with chemical formulas, atomic numbers, molecular masses, reactions, and physical properties.
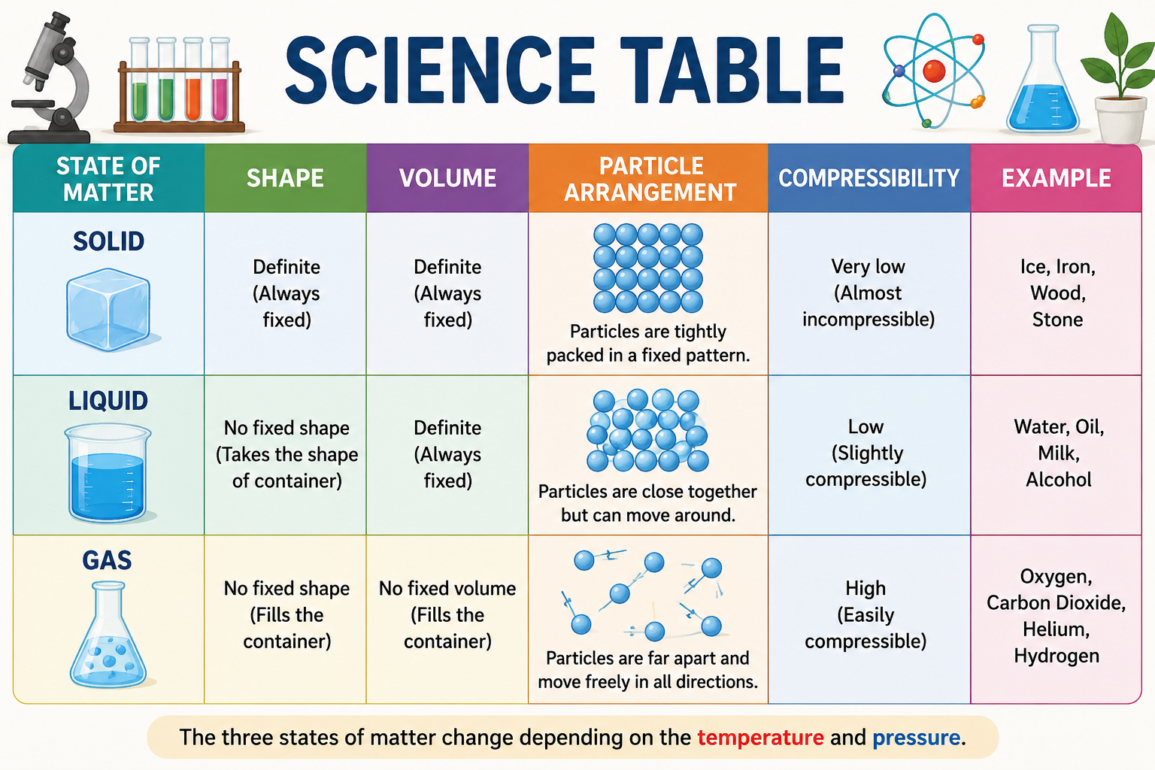
A science table can organize the properties of substances such as melting point, boiling point, density, and state of matter. Tables can also help students compare elements and compounds.
During laboratory work, students can record quantities of reactants, reaction times, temperatures, and visible changes. This structured information can later support calculations and conclusions.
Science Tables in Physics
Physics involves measurements and relationships between variables. Tables are therefore essential for many physics experiments.
A student investigating motion might record time and distance. Another experiment could examine voltage and current. By organizing the measurements in a science table, students can identify relationships between variables before creating a graph.
Tables also make it easier to check calculations and identify measurements that may need additional investigation.
Digital Science Tables
Modern students and researchers often create tables using digital tools. Spreadsheet applications allow users to organize large datasets and perform calculations automatically.
Digital tables can include formulas, sorting functions, filters, and charts. These features become especially useful when an investigation involves hundreds or thousands of observations.
However, technology does not replace scientific accuracy. A well-designed digital science table still needs clear headings, correct units, consistent formatting, and reliable data.
Common Mistakes to Avoid
Several mistakes can reduce the usefulness of a scientific table. One common problem is using vague headings. Readers should never have to guess what a column represents.
Another mistake involves missing units. A value such as “25” has little meaning if the reader does not know whether it represents grams, centimeters, degrees, or another measurement.
Overcrowding is another issue. A science table should contain relevant information rather than every detail collected during an investigation. Extra information can make important results harder to identify.
Students should also avoid changing unusual results without a valid scientific reason. If an observation appears incorrect, it should be checked rather than silently removed.
Benefits of Using a Science Table
The value of a science table extends beyond neat presentation. Tables help students develop important scientific skills.
First, they improve organization. Information remains in a predictable structure, which makes it easier to locate specific results.
Second, tables support comparison. Readers can examine multiple values or categories without moving between different sections of text.
Third, they improve analysis. Organized measurements make it easier to recognize trends, differences, and possible relationships.
Finally, tables improve communication. Scientific findings become easier for other people to understand and evaluate.
Science Tables and Scientific Thinking
Scientific thinking involves asking questions, collecting evidence, examining results, and developing conclusions. A science table can support several stages of this process.
During an investigation, it provides a place to record evidence. After data collection, the organized information can help researchers compare results. The same data can then support graphs, calculations, and written conclusions.
This makes tables more than simple formatting tools. They can become an important part of the scientific reasoning process.
Tips for Students
Students can improve their scientific tables by keeping several simple principles in mind. Use a meaningful title, clear headings, appropriate units, and consistent formatting. Record observations immediately whenever possible so important details are not forgotten.
It is also useful to review the table before submitting an assignment. Check spelling, numerical accuracy, units, and whether every column contains the intended information.
A science table should make information simpler, not more confusing. If a reader can understand the data quickly, the table is performing its purpose effectively.
Conclusion
A science table is a simple but powerful way to organize scientific information. It can record observations, display measurements, compare concepts, classify materials, and present experimental results. From school laboratories to professional research environments, tables help transform scattered information into a clear structure.
The best tables focus on accuracy, clarity, consistency, and relevance. When students learn to design and use them correctly, they can analyze evidence more effectively and communicate their findings with greater confidence. Whether the subject is biology, chemistry, physics, or environmental science, a well-prepared science table remains an essential tool for understanding and presenting scientific information.
Frequently Asked Questions
What is a science table used for?
A science table is used to organize observations, measurements, experimental results, classifications, and comparisons in an easy-to-read format.
Why are tables useful in science?
Tables make scientific information easier to record, compare, analyze, and communicate. They are especially useful when an investigation produces multiple measurements.
What should a science table include?
A good table normally includes a clear title, descriptive column headings, relevant data, and measurement units where necessary.
Can students create science tables digitally?
Yes. Students can create tables using spreadsheet programs and other digital tools. Digital formats are particularly useful for large datasets and automatic calculations.
How can I make a science table easier to understand?
Use simple headings, consistent units, accurate values, and only relevant information. Avoid unnecessary details that make the table difficult to read.