

Understanding decimals becomes much easier when students can see how numbers represent parts of a whole. Instead of memorizing rules, learners can use pictures, grids, number lines, and everyday objects to explore decimal values. Decimal models provide a visual way to understand tenths, hundredths, and thousandths while building confidence in mathematical reasoning. They help students connect fractions, decimals, and real-life measurements through practical examples.
Whether students are learning decimals for the first time or reviewing concepts before an exam, visual representations can make abstract ideas more understandable. Teachers can use these strategies to explain place value, compare decimal numbers, and demonstrate mathematical operations. Parents can also introduce these activities at home to make learning more engaging.
This guide explains how decimal representations work, explores different types, and provides practical examples that students can use to strengthen their mathematics skills.
What Are Decimal Models?
Decimal models are visual representations that show the value of decimal numbers. They help learners understand how a decimal divides a whole into smaller, equal parts. These representations make it easier to identify the relationship between a whole number and its fractional components.
For example, the decimal 0.5 represents five tenths, which is equal to one-half. A visual model can show this relationship by dividing a shape into ten equal sections and shading five of them.
Similarly, 0.25 represents twenty-five hundredths, or one-quarter. A hundred-square grid makes this value visible because students can shade twenty-five of the one hundred small squares.
These visual tools support conceptual understanding rather than simple memorization. When students work with decimal models, they can observe why digits have different values depending on their positions and how decimals relate to fractions.
Why Are Decimal Models Important in Mathematics?
Learning decimals can be challenging because students often confuse digits after the decimal point with whole-number positions. Visual representations help address this difficulty by connecting abstract numbers with shapes and quantities that learners can recognize.
Building Place Value Understanding
Place value determines the meaning of each digit in a number. In 0.36, the digit 3 represents three tenths, while the digit 6 represents six hundredths. A suitable visual representation allows students to distinguish these values.
Decimal models also show that ten hundredths equal one tenth and ten tenths equal one whole. Understanding these relationships prepares students for more advanced topics, including decimal multiplication and division.
Connecting Fractions and Decimals
Fractions and decimals express parts of a whole in different forms. For example, one-half can be written as 0.5, while one-quarter can be written as 0.25.
Using decimal models, students can shade portions of a shape and write the corresponding fraction and decimal. This process helps them recognize equivalent values and understand that different numerical expressions can represent the same quantity.
Improving Problem-Solving Skills
Visual learning encourages students to explain their thinking instead of relying entirely on memorized procedures. When learners compare shaded areas, place values, or number-line positions, they can justify their answers more confidently.
These strategies also encourage mathematical communication. Students can describe what a model represents, identify errors, and explain how they reached a conclusion.
Common Types of Decimal Models
Different representations serve different learning purposes. Teachers should select a model that matches the concept being taught and the student’s current level of understanding.
1. Decimal Base-Ten Grids
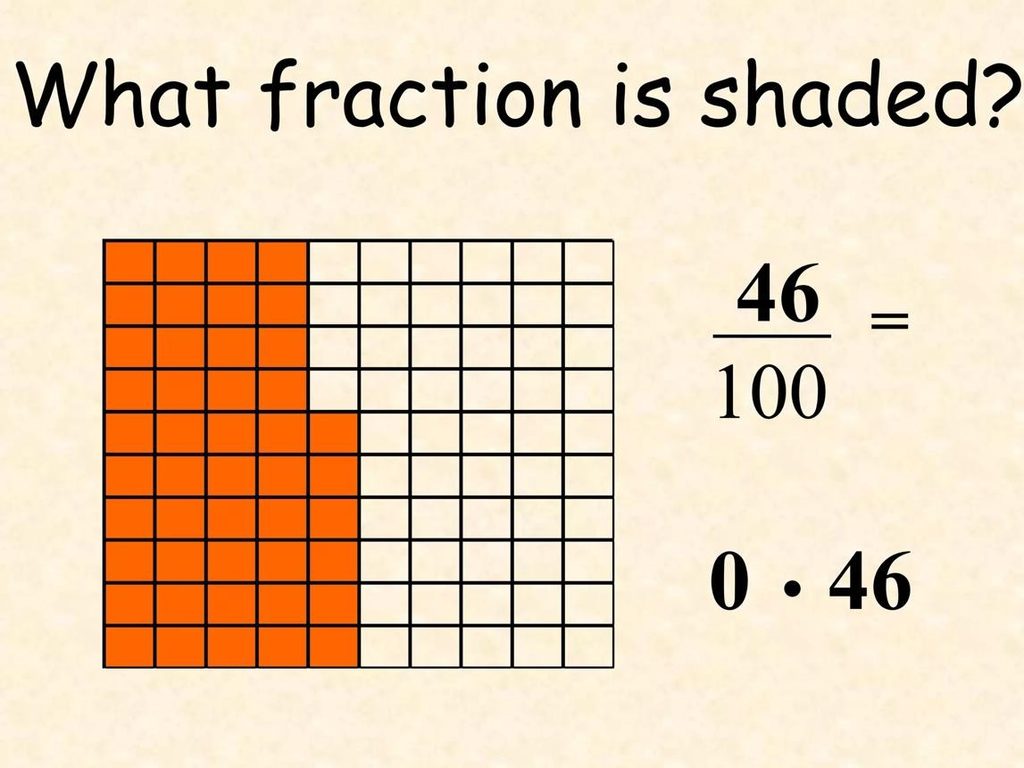
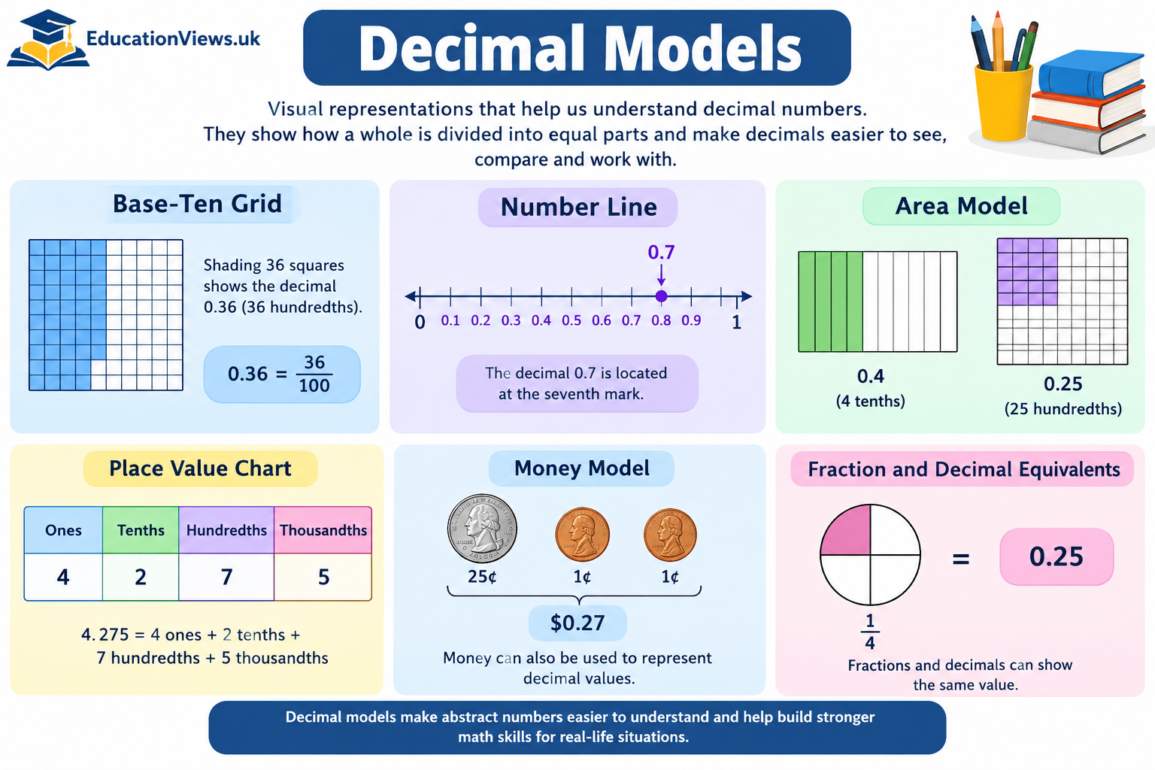
A base-ten grid is one of the most familiar decimal models. A typical hundred-square grid contains ten rows and ten columns, creating 100 equal squares. Each small square represents one hundredth of the complete grid.
If a student shades 36 squares, the shaded area represents 0.36. Shading 50 squares represents 0.50, which is equivalent to 0.5. Students can use these grids to compare values, identify equivalent decimals, and understand decimal addition.
Teachers can also use a large square to represent one whole, a row of ten squares to represent one tenth, and a single small square to represent one hundredth. This approach helps learners see the relationship between different place values.
2. Decimal Number Lines
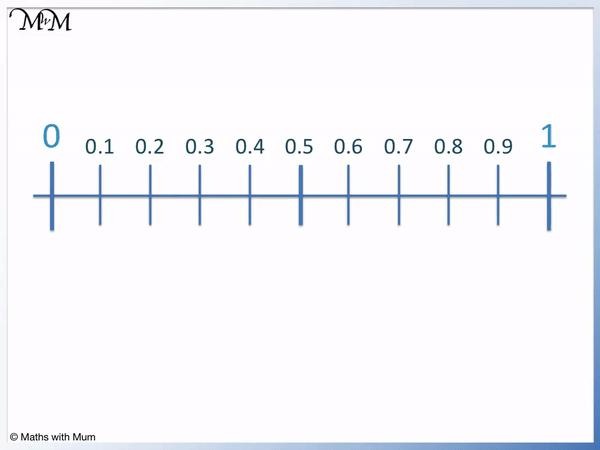
A number line represents decimals according to their positions between whole numbers. Students can divide the distance from zero to one into ten equal intervals to identify tenths.
For example, 0.7 appears at the seventh mark after zero. If the line is divided into 100 equal intervals, students can locate hundredths with greater precision.
Number lines are particularly useful for comparing decimals. A point farther to the right represents a greater value. Therefore, 0.8 is greater than 0.6 because it appears farther along the line.
Students can also use number lines to round decimals, estimate sums, and understand how decimal values increase or decrease.
3. Decimal Area Models
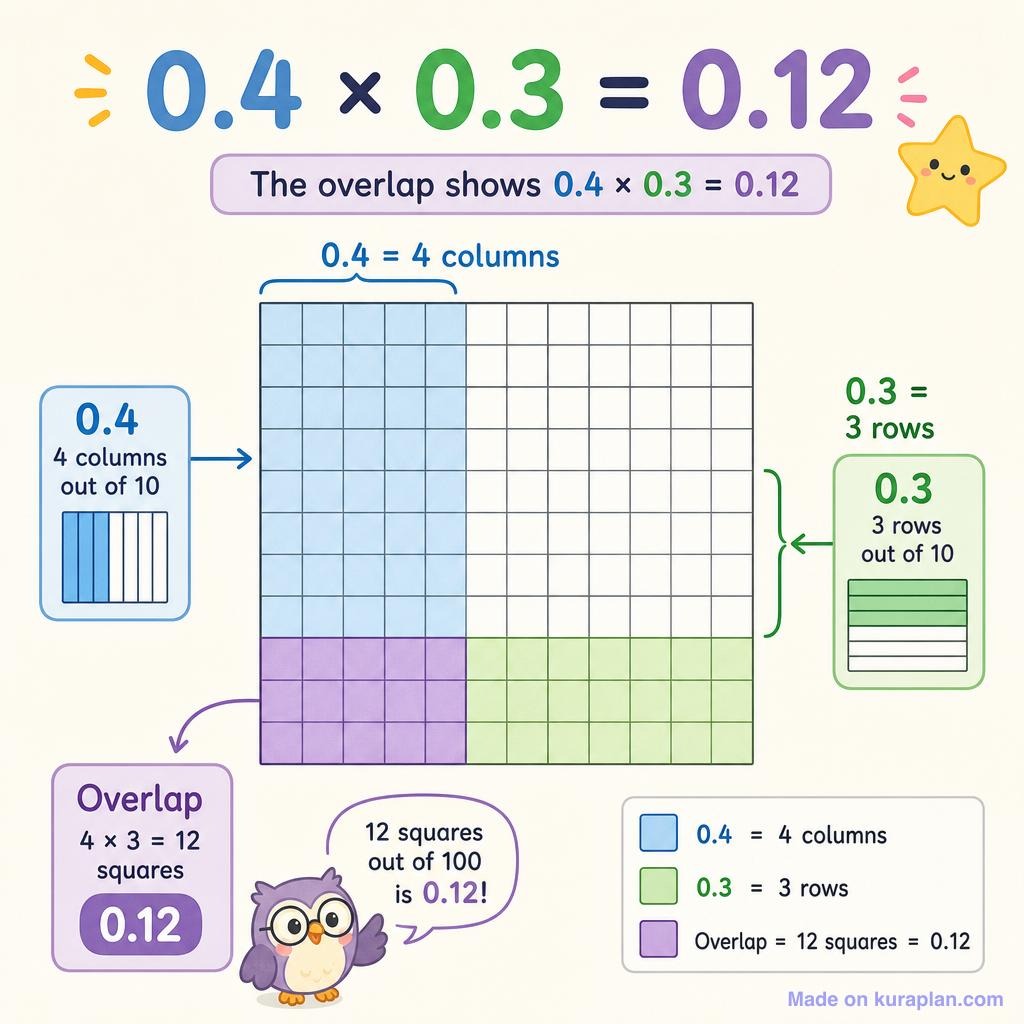
Area models use rectangles, squares, or circles to represent decimal quantities. Students divide a shape into equal sections and shade the portion that corresponds to a particular value.
For example, dividing a rectangle into ten equal parts and shading four parts represents 0.4. Dividing another rectangle into 100 equal parts and shading 25 represents 0.25.
These decimal models work well when introducing multiplication. If a student shades 0.5 of a rectangle and then identifies half of that shaded region, the result represents 0.25. This provides a visual explanation of why multiplying 0.5 by 0.5 produces 0.25.
4. Decimal Place Value Charts
A place value chart organizes digits according to their numerical positions. It commonly includes columns for ones, tenths, hundredths, and thousandths.
Consider the number 4.275. The digit 4 represents four ones, 2 represents two tenths, 7 represents seven hundredths, and 5 represents five thousandths.
Students can place each digit in the correct column to understand its contribution to the complete number. This representation also helps prevent common mistakes, such as assuming that 0.45 is greater than 0.8 simply because 45 is greater than 8.
5. Decimal Money Models
Money offers a familiar way to explore decimals because prices frequently contain two digits after the decimal point. For example, $1.25 represents one dollar and twenty-five cents.
Students can use coins, price tags, or pretend shopping activities to connect decimal notation with practical situations. They can calculate totals, compare prices, and determine change.
Money-based decimal models are especially useful for younger learners because they connect classroom mathematics with everyday financial decisions.
How to Use Decimal Models Step by Step
Students can follow a consistent process to represent and interpret decimal values accurately.
Step 1: Identify the whole. Determine what the complete shape, grid, or object represents. Without this reference point, students may misunderstand the value of a shaded portion.
Step 2: Count the equal parts. Identify how many sections divide the whole. Ten sections commonly represent tenths, while 100 sections represent hundredths.
Step 3: Shade or mark the required amount. Represent the decimal by shading the correct number of sections or marking its position on a number line.
Step 4: Write the decimal number. Convert the visual representation into decimal notation. For example, shading 42 out of 100 squares gives 0.42.
Step 5: Explain the value. Ask students to describe what each digit represents. This final step checks whether they understand the concept instead of merely copying a picture.
Following these steps makes decimal models easier to use in independent practice, classroom discussions, and mathematics assessments.
Examples of Decimal Models in Practice
Practical examples help students connect visual representations with numerical calculations.
Example 1: Representing 0.3
Imagine a rectangle divided into ten equal parts. Shade three sections and leave seven unshaded. The shaded portion represents three tenths, written as 0.3.
This example introduces decimal notation and shows why the digit 3 appears in the tenths position.
Example 2: Representing 0.65
Imagine a hundred-square grid with 65 shaded squares. The shaded portion represents 65 hundredths, or 0.65.
Students can compare this representation with a grid showing 0.60. The additional five shaded squares demonstrate that 0.65 is greater than 0.60.
Example 3: Comparing 0.4 and 0.35
At first, students might think 0.35 is greater than 0.4 because 35 is greater than 4. Visual representations help correct this misunderstanding.
Represent 0.4 as 40 hundredths by shading 40 squares on a hundred-square grid. Then shade 35 squares on another grid. The first grid contains five more shaded squares, demonstrating that 0.40 is greater than 0.35.
These decimal models show why aligning place values is essential when comparing decimal numbers.
Example 4: Adding 0.2 and 0.5
Use a number line divided into tenths. Start at 0.2 and move five tenths to the right. You arrive at 0.7.
Therefore, 0.2+0.5=0.7.
Students can also use a grid by shading two tenths in one color and five additional tenths in another color. The combined shaded area represents seven tenths.
Example 5: Understanding 0.25 as a Fraction
Shade 25 squares on a hundred-square grid. The shaded portion represents 25/100, which simplifies to 1/4.
This activity shows that decimal values and fractions can describe the same quantity. It also prepares students to work with equivalent fractions and percentage conversions.
Using Decimal Models for Mathematical Operations
Visual representations can support more than identifying decimal values. They can also help students understand basic mathematical operations.
Decimal Addition and Subtraction
Students can use hundred-square grids to add or subtract decimal quantities. For example, adding 0.20 and 0.35 gives 0.55. Shading 20 squares and then 35 additional squares demonstrates the combined quantity.
For subtraction, students can begin with 0.70 and remove 0.25. The remaining 45 hundredths represent 0.45. These decimal models help students understand regrouping and the relationship between digits.
Decimal Multiplication
Area models provide a useful introduction to decimal multiplication. Students can represent one decimal along the horizontal side of a rectangle and another along the vertical side. The overlapping shaded region illustrates the product.
For instance, multiplying 0.3 by 0.2 produces 0.06. A grid can demonstrate this result by showing six overlapping hundredths.
Decimal Division
Students can use place value blocks, grids, or money to understand division. For example, dividing $1.20 equally among four people gives each person $0.30. Representing the total amount and separating it into four equal groups makes the calculation easier to understand.
Common Mistakes Students Should Avoid
Although visual representations simplify decimal learning, students still need to pay attention to several important details.
One common mistake involves confusing tenths with hundredths. A shaded area representing 0.4 is larger than one representing 0.04, even though both numbers contain the digit 4. Students should always check the place value.
Another mistake occurs when students compare decimals without aligning their place values. Writing 0.4 as 0.40 makes comparison with 0.35 easier because both numbers have two decimal places.
Students should also remember that the whole must remain consistent when comparing shaded areas. If one grid represents one whole and another represents ten wholes, identical shaded sections do not necessarily represent identical quantities.
Finally, students should connect pictures with numerical notation. A model becomes more useful when learners can explain what it represents and translate it into a mathematical expression.
Tips for Teachers and Parents
Teachers can introduce decimal models through short, structured activities before moving to formal calculations. Begin with tenths, introduce hundredths, and then progress to thousandths when students demonstrate understanding.
Parents can reinforce these concepts through cooking measurements, shopping receipts, rulers, and measuring cups. Asking children to estimate quantities before calculating the exact answer encourages independent thinking.
Digital worksheets and interactive mathematics tools can provide additional practice, but physical grids and handwritten drawings remain valuable. Students benefit from moving between concrete objects, visual representations, and abstract numbers.
The most effective approach combines several representations rather than relying on a single method. When learners can explain the same decimal using a grid, a fraction, a number line, and a real-life example, their understanding becomes more flexible.
Conclusion
Decimal models provide a practical foundation for understanding decimal notation, place value, fractions, and mathematical operations. By using grids, number lines, area diagrams, place value charts, and money examples, students can visualize numerical relationships that might otherwise seem confusing.
These strategies encourage deeper understanding, improve problem-solving skills, and help learners recognize decimals in everyday situations. Regular practice with different representations also prepares students for more advanced mathematical concepts.
Whether used in classrooms or at home, decimal models make mathematics more accessible by connecting abstract numbers with visible quantities. With consistent guidance and meaningful practice, students can develop the confidence to interpret, compare, and calculate decimals accurately.
Frequently Asked Questions
1. What are decimal models used for?
Decimal models help students visualize decimal numbers and understand place value, fractions, comparisons, and mathematical operations. They connect numerical notation with pictures and measurable quantities.
2. What is the easiest decimal model for beginners?
A ten-part strip is an excellent starting point. Students can shade individual sections to represent tenths before progressing to hundred-square grids for hundredths.
3. How does a hundred-square grid represent decimals?
A hundred-square grid contains 100 equal squares. Each square represents 0.01 of the whole, so shading 35 squares represents 0.35.
4. Can decimal models help compare numbers?
Yes. Students can compare shaded areas or locate decimals on a number line. These methods show why 0.60 is greater than 0.45 and why 0.40 is greater than 0.35.
5. Are decimal models useful for older students?
Yes. Older students can use visual representations to explore decimal multiplication, division, equivalent fractions, percentages, estimation, and more advanced mathematical relationships.